Introduction
Microsoft Sentinel Workbooks are designed to visualize logs that occurs in our environment so we can better secure and respond to incidents, alerts, and threat actors. I recently decided to implement Microsoft Sentinel Workbooks to monitor domain admin accounts to protect them from brute-force and password spray attacks.
Implemention
Using Microsoft Sentinel Workbooks we can implement monitoring for domain admin accounts and other assets which needs more attention than others. Here’s a overview of Microsoft Sentinel Workbook that I made to monitor domain admin accounts.
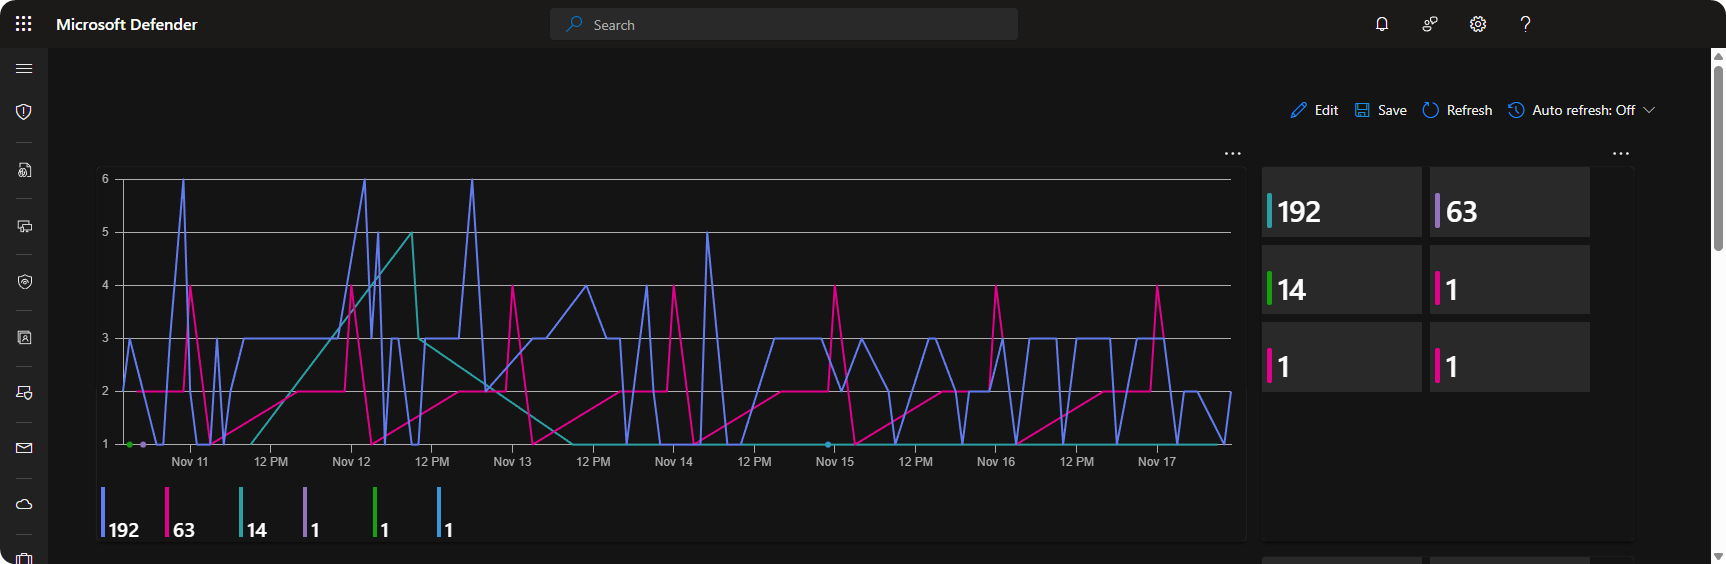
We can monitor failed logon attempts to domain admin accounts through the SecurityEvents table. This allows us to create timechart and tiles to better highlight the total failed logon attempts and patterns. Here’s KQL queries to implement the timechart and tiles.
let domainAdmins = (_GetWatchlist("DomainAdmins") | project UserPrincipalName);
SecurityEvent
| where TimeGenerated > ago(7d)
| where EventID == "4625"
| where TargetUserName in (domainAdmins)
| summarize arg_max(TimeGenerated, *) by TimeGenerated
| summarize count() by bin(TimeGenerated, 1h), TargetUserName
| render timechart let domainAdmins = (_GetWatchlist("DomainAdmins") | project UserPrincipalName);
SecurityEvent
| where TimeGenerated > ago(7d)
| where EventID == "4625"
| where TargetUserName in (domainAdmins)
| summarize arg_max(TimeGenerated, *) by TimeGenerated
| summarize FailedLogons = count() by TargetUserName
| project TargetUserName, FailedLogons
| sort by FailedLogonsWe can further improve the dashboard by adding another panel where we can see which computer and servers experienced these high frequency of failed logon attempts with logs. Here’s a overview of the servers and computers who experienced high frequency of failed logon attempts.
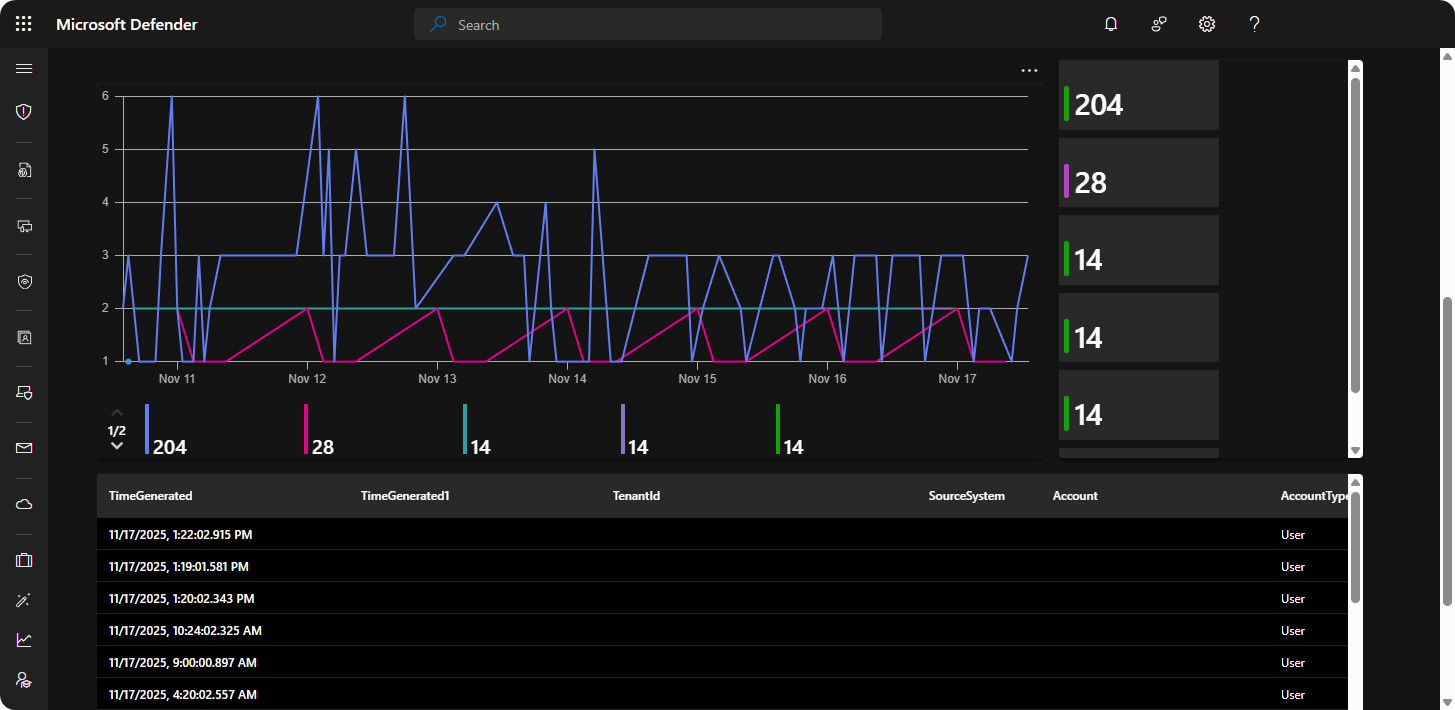
As mentioned previously we can continue using SecurityEvents table but filter the data by Computer to see the computer and servers that experienced these high frequency of failed logon attempts. Here’s a overview of KQL queries for implementing Timechart, Tiles, and Logs.
let domainAdmins = (_GetWatchlist("DomainAdmins") | project UserPrincipalName);
SecurityEvent
| where TimeGenerated > ago(7d)
| where EventID == "4625"
| where TargetUserName in (domainAdmins)
| summarize arg_max(TimeGenerated, *) by TimeGenerated
| summarize count() by bin(TimeGenerated, 1h), Computer
| render timechartlet domainAdmins = (_GetWatchlist("DomainAdmins") | project UserPrincipalName);
SecurityEvent
| where TimeGenerated > ago(7d)
| where EventID == "4625"
| where TargetUserName in (domainAdmins)
| summarize arg_max(TimeGenerated, *) by TimeGenerated
| summarize FailedLogons = count() by Computer
| sort by FailedLogonslet domainAdmins = (_GetWatchlist("DomainAdmins") | project UserPrincipalName);
SecurityEvent
| where TimeGenerated > ago(7d)
| where EventID == "4625"
| where TargetUserName in (domainAdmins)
| summarize arg_max(TimeGenerated, *) by TimeGenerated
| take 100Using these custom KQL queries you should now have a workbook which monitors domain admin accounts where you will be able to view the accounts and computers these high frequency of failed logons occurred in your environment.
Conclusion
Microsoft Sentinel Workbooks is desinged to visualize thousands of logs data. It’s also excellent for security analysts as it can help with detecting and responding to alerts, incidents, and threat actors. All organization’s should consider implementing Microsoft Sentinel Workbooks since it will display a quick overview of their environment.